|
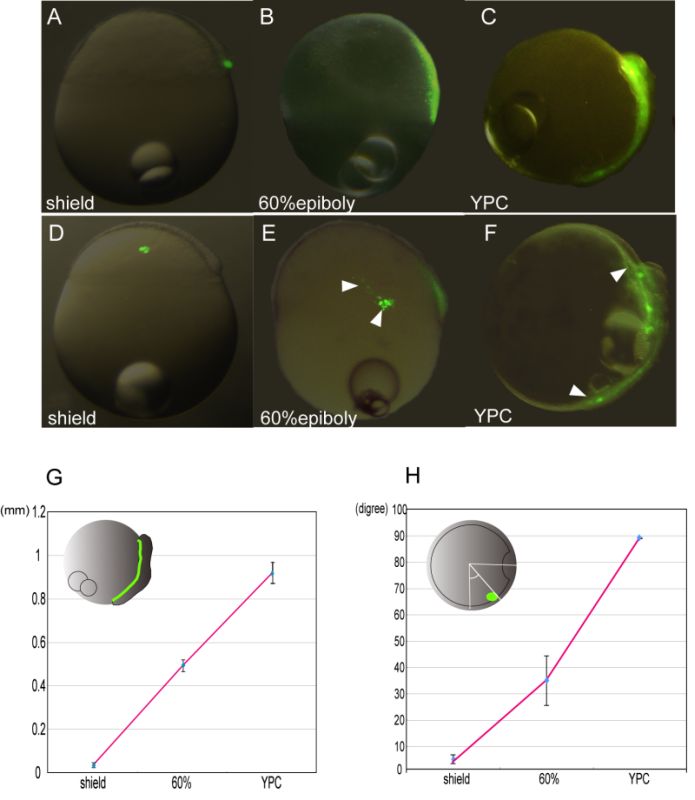
Figure 10-23.
Quantitative analysis of movements of cell population using caged fluorescent dye. (A–C and G) Labeled dorsal cells migrated anteriorly along the anterior–posterior axis (A–C). The distribution of labeled dorsal cell population was measured at each point. The degree of the cell movement was quantified and shown by a graph (G). (D–F, and H) Labeled lateral cells migrated dorsally, stretching along the animal–vegetal axis (D–F, arrowhead). The angle between the lateral-most (90° from dorsal midline) and migration front of the labeled cell population was measured. The degree of cell movement was quantified and graphed (H). |