|
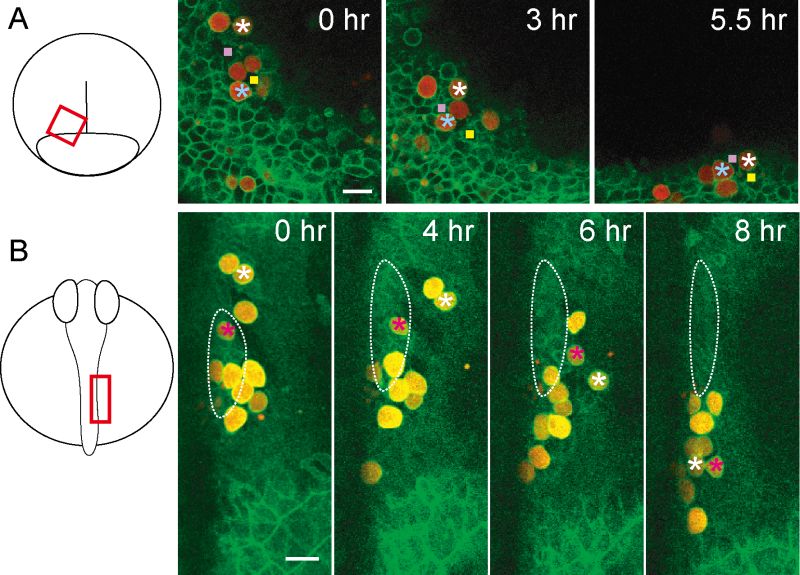
Figure 10-10. Time-lapse imaging of PGC migration. PGCs and cell membrane were visualized by co-injection of dsRed nanos-3′UTR RNA and Lyn-Venus (membrane-associated GFP) RNA. (A) Medial migration of PGCs at stages 16–17. PGCs (asterisks) moved toward the embryonic body along with somatic cells (filled squares). (B) Posterior migration of PGCs at stages 23–24. PGCs (asterisks) migrated posteriorly, independent of the somatic cells (surrounded by white dotted line) which moved medially. Scale bars, 20 μm. (Reproduced from Kurokawa et al., 2006, with permission of John Wiley & Sons, Inc.) |