|
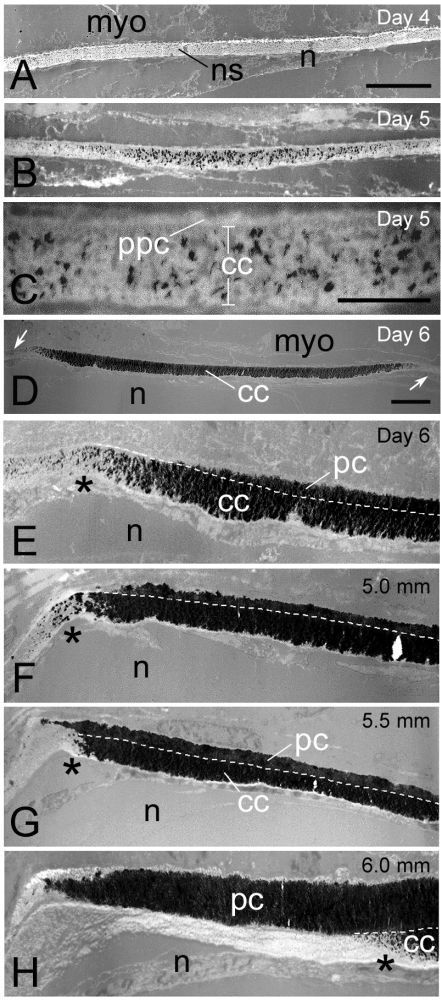
Figure 6-53.
Transmission electron micrographs showing progressive mineralization of the centrum. (A–H) Horizontal sections of ethanol-fixed and anhydrously treated specimens. Anterior is to the left. (A) 4-dpf embryo. No mineral deposition is evident in the notochordal sheath (ns). (B) 5-dpf embryo. Mineral crystals (black dots) first appear within the notochordal sheath. (C) High-magnification micrograph of the chordal centrum (cc) in a 5-dpf embryo. No mineral deposition is evident in the prospective perichordal centrum (ppc). (D) Newly hatched larva (6-dpf). Low-magnification micrograph showing the mineralized chordal centrum (cc). The arrows indicate the intervertebral ligaments. (E–H) Anterior edges of centra at various developmental stages after hatching. (E) Magnified region of the image shown in D. Larva with body lengths of approximately (F) 5.0 mm, (G) 5.5 mm, and (H) 6.0 mm are shown. The white dotted lines indicate the boundary between the chordal centrum (cc) and perichordal centrum (pc). The asterisk indicates the anterior edge of the chordal centrum. myo, myotome; n, notochord. Scale bars: A, 2 μm (also applies to B and E–H); C, 500 nm; D, 4 μm. (Inohaya et al., 2007. Reproduced with permission of John Wiley & Sons, Inc.) |