|
|
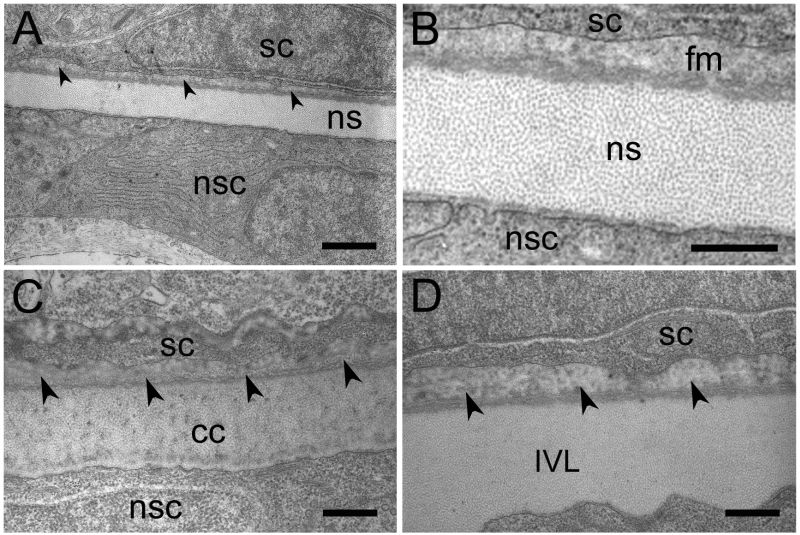
Figure 6-52.
Transmission electron micrograph of the bone matrix around the notochord (horizontal sections). Anterior is to the left. (A) 4-dpf embryo. (B) Magnified region of the image shown in A. (C, D) Newly hatched larva (6-dpf). (C) High-magnification image showing a portion of the chordal centrum (cc). (D) High-magnification image of a region of the intervertebral ligament (IVL). Arrowheads indicate the fibrous matrix of the perichordal centrum. fm, fibrous matrix; ns, notochordal sheath; nsc, notochordal sheath cell; sc, presumed sclerotomal cell. Scale bars: A, 1 μm; B, 400 nm; C and D, 500 nm. (Inohaya et al., 2007. Reproduced with permission of John Wiley & Sons, Inc.) |