Figure 5-10.
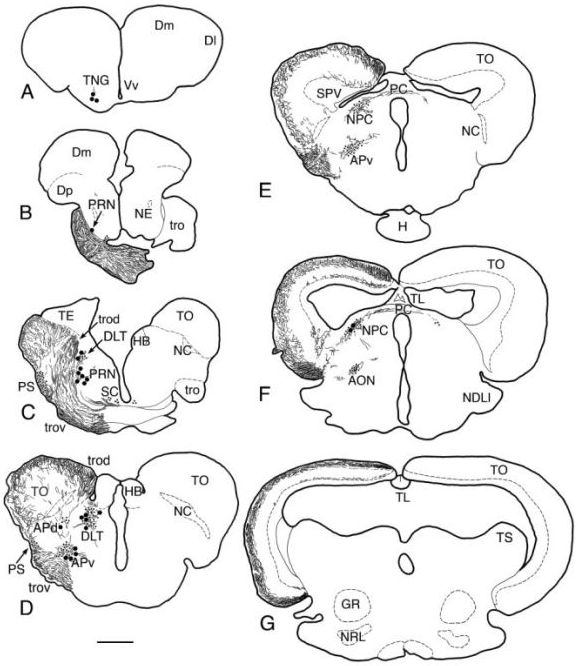
Representative frontal sections from the telencephalon (A) to the mesencephalon (G), showing the distribution of retinal projections and retinopetal neurons. The left optic nerve was injected with biocytin. Labeled fibers (thin lines), terminals (small dots), and retrogradely labeled cells (large dots) are illustrated. Scale bar, 200 μm. (Reproduced from Deguchi et al., 2005, with permission of The Zoological Society of Japan; Copyright (2005) The Zoological Society of Japan.)
Representative frontal sections from the telencephalon (A) to the mesencephalon (G), showing the distribution of retinal projections and retinopetal neurons. The left optic nerve was injected with biocytin. Labeled fibers (thin lines), terminals (small dots), and retrogradely labeled cells (large dots) are illustrated. Scale bar, 200 μm. (Reproduced from Deguchi et al., 2005, with permission of The Zoological Society of Japan; Copyright (2005) The Zoological Society of Japan.)
AON, accessory optic nucleus; APd, area pretectalis pars dorsalis; APv, area pretectalis pars ventralis;
Dm, area dorsalis telencephali pars medialis; Dl, area dorsalis telencephali pars lateralis;
DLT, nucleus dorsolateralis thalami; Dp, area dorsalis telencephali pars posterior;
GR, corpus glomerulosum pars rotunda; H, hypophysis (pituitary gland); HB, habenula;
NC, nucleus corticalis; NDLI, nucleus diffusus lobi inferioris; NE, nucleus entopeduncularis;
NPC, nucleus of the posterior commissure; NRL, nucleus reccesus lateralis; PC, posterior commissure;
PRN, preoptic retinopetal nucleus; PS, nucleus pretectalis superficialis; SC, suprachiasmatic nucleus;
SPV, stratum periventriculare; TE, telencephalon; TL, torus longitudinalis; TNG, terminal nerve ganglion;
TO, optic tectum; tro, optic tract; trod, dorsomedial optic tract; trov, ventrolateral optic tract;
TS, torus semicircularis; Vv, area ventralis telencephali pars ventralis.